Measuring "climate shift" across the world's oceans
Another systematic tool to help us understand what's going on
When I was a young analyst roaming the halls of the Pentagon in the 1990s, I was always looking for cheat sheets, or little guides that kept very large things straight in my head. One of my early favorite phrases was “Are we talking a bread basket here or a bread truck?”
It was just a quick way to orient the discussion regarding magnitude (like That’s billion with a B! [now replaced with the variant That’s trillion with a T!). The US Defense Department is its own scale, basically, and you need special language cues to remind yourself of that.
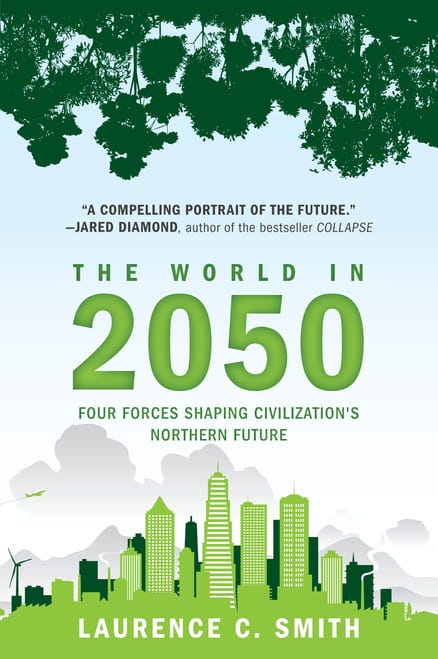
In America’s New Map, I do that with regard to the loss/gain of “livable” land due to climate change. First, I found a bit from geographer Laurence Smith (brilliant guy) in his book The New North: The World in 2050 (part of my “external canon”), where he estimated that roughly 14m square kilometers of land in the planet’s northern quartile would, in effect, be revealed and made livable to humans. Then I found all sorts of estimates (mostly UN-derived) regarding extreme drought/heat rendering roughly the same amount of land (or far worse, depending on the projection) unlivable across the lower latitudes across the century. Then I looked up the sizes of various countries and figured out that 14m square km was essentially two Australias. Thus, my bread basket/truck measure here is to say that climate change essentially takes two Australias worth of livable land from Middle Earth and gifts it to the New North in what I call the biggest real estate transaction in human history — with no money changing hands.
You present that concept to people, and they get it, two Australias being roughly 1/10th of the world’s landmass outside of Antarctica (14m/148m=9.5%).
Recently I cited (for my own future use), this brilliant graf from David Wallace-Wells of the NYT regarding farming:
More than one-third of the planet’s land is used to produce food, and 70 percent of all fresh water is used to irrigate farmland. Pacing the supermarket aisle, you might think that whatever you’re buying for lunch or dinner is produced out there somewhere on the periphery of modern life. But globally, the equivalent of South America is now used to grow crops, and the equivalent of Africa is used to graze animals. Combined, this is more of the world’s surface than is occupied by forests and more than 10 times as much land as is occupied by all human settlement. And according to the World Resources Institute, we may need to add almost two Indiasto the world’s existing farmland to meet food needs in the second half of this century. — but adding that farmland means cutting down forests, which store carbon, in order to graze more animals, which produce carbon.
An entire South America to grow crops, an Africa to graze for meat production, and (conceivably) two Indias to come online to cover population/demand growth for food.
THAT, my friends, is broad framing.
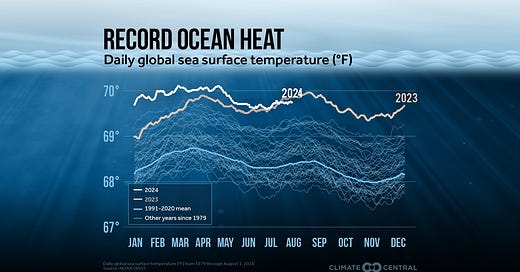
Now, when it comes to how climate change impacts the world’s oceans and how they, in turn, impact the world’s weather, shorelines, etc., that gets even harder. The scale of the oceans is so vast (70% of the world’s surface, 97% of our total water) … it’s just not easy to work with.
So, along comes this new Climate Shift Index: Ocean from Climate Central:
Climate Central is an independent group of scientists and communicators who research and report the facts about our changing climate and how it affects people’s lives. We are a policy-neutral 501(c)(3) nonprofit.
Good stuff, right?
They explain their approach in this peer-reviewed paper entitled “Attributing daily ocean temperatures to anthropogenic climate change.”
Sexy, I know.
What drew me to this index is its counterfactual approach: they look at something like warm water temps or a hurricane and calculate how likely it is that climate change is responsible: like, maybe 400 times more likely:
Hurricane Beryl, the first hurricane of the 2024 Atlantic hurricane season, caused an estimated $6 billion in damages and killed at least 37 people in the U.S. since making landfall in Texas on July 8. This doesn’t include damage and fatalities across the Caribbean and Yucatán Peninsula.
Beryl's rapid intensification into the earliest Category 5 Atlantic hurricane on record — which left less time for communities in the storm path to prepare — was fueled in part by exceptionally warm oceans.
Climate Central’s Climate Shift Index: Ocean reveals how human-caused climate change altered the likelihood of these ocean temperatures.
According to Ocean CSI, Hurricane Beryl developed and intensified over unusually warm waters whose temperatures were made up to 400 times more likely by human-caused climate change.
How they calculate (from the peer-reviewed paper):
Abstract
Ocean temperatures are rising and hit record levels around the world in 2023. While trends are clear and likely strongly connected to human-caused climate change, the oceans also exhibit variability on the daily level, leading to local extremes such as marine heatwaves. We present an operational system to estimate the impact of human-caused climate change on daily sea surface temperatures anywhere in the ocean. This system uses a multi-method approach combining observed trends and paired control/forced climate model runs from CMIP6. Our approach is novel in its flexibility and ease of application for global, daily use for any day since the beginning of the satellite era (1982–2023). The system allows for rapid evaluation for further study of attributable ocean temperatures and real-time communications of attributable ongoing events. We apply the system to well-documented heatwaves in the Tasman Sea, Gulf of Maine, and Mediterranean Sea over the past decade, as well as global conditions in July 2023, to confirm that the system produces estimates consistent with other attribution methods, and to simulate how our system handles interesting events as they are occurring. Each of these events strongly reflected impacts of climate change: their temperatures were consistently made at least four times as likely to occur in our human-influenced climate than in a world without climate change. Meanwhile, in July 2023, almost all (%) of the ocean's temperatures were made at least twice as likely to occur on any given day. Rapid attribution of daily ocean temperatures provides a pathway for quantifying the influence of climate change on ecological impacts like coral bleaching and on ocean-generated/influenced storms like tropical cyclones.
Pretty good, huh?
Ways to use the index are suggested:
Five ways to use the Climate Shift Index: Ocean
Use the tool. The online map tool allows you to explore data showing which parts of the world are experiencing high Ocean CSI levels — every day.
Share custom maps. Use yellow buttons in the tool’s left panel to share a direct link to a custom map or download the current map view as a PNG file.
Download maps in KML format. The tool’s left panel also includes a link to download daily Ocean CSI maps in KML format for use in TV broadcasts.
Read the FAQs. Review common questions and answers on the science behind the Ocean CSI and expert guidance and caveats on using the tool in climate reporting.
Go deeper: read the peer-reviewed paper. Published by Climate Central scientists in May 2024, this openly accessible peer-reviewed paper presents the science behind the Ocean CSI system.
All good stuff, but let me leave you with some bread basket/truck data points — the very ones that drove me to search out this index because I wanted something more systematic and scientific to cite.
Keep reading with a 7-day free trial
Subscribe to Thomas P.M. Barnett’s Global Throughlines to keep reading this post and get 7 days of free access to the full post archives.


