


Ranking superpowers by demand power across world regions
An exercise in broad-framing trade in terms of the rule-setting power it imparts


Working on the follow-on MOOC (massive open online course) to my first one (Superpower Grand Strategies: Winning the Globalization Game) and wanted to calculate how my five superpowers compare when it comes to trade presence (export share/import share) across the world’s major regions.
Did all these calculations at the fabulous Observatory of Economic Complexity, where you can type in the names of the countries you’re surveying and then get these fabulous tree diagrams about where they export to, and import from, around the world.
So, here, for example, is the tree map for US export destination and import sources:
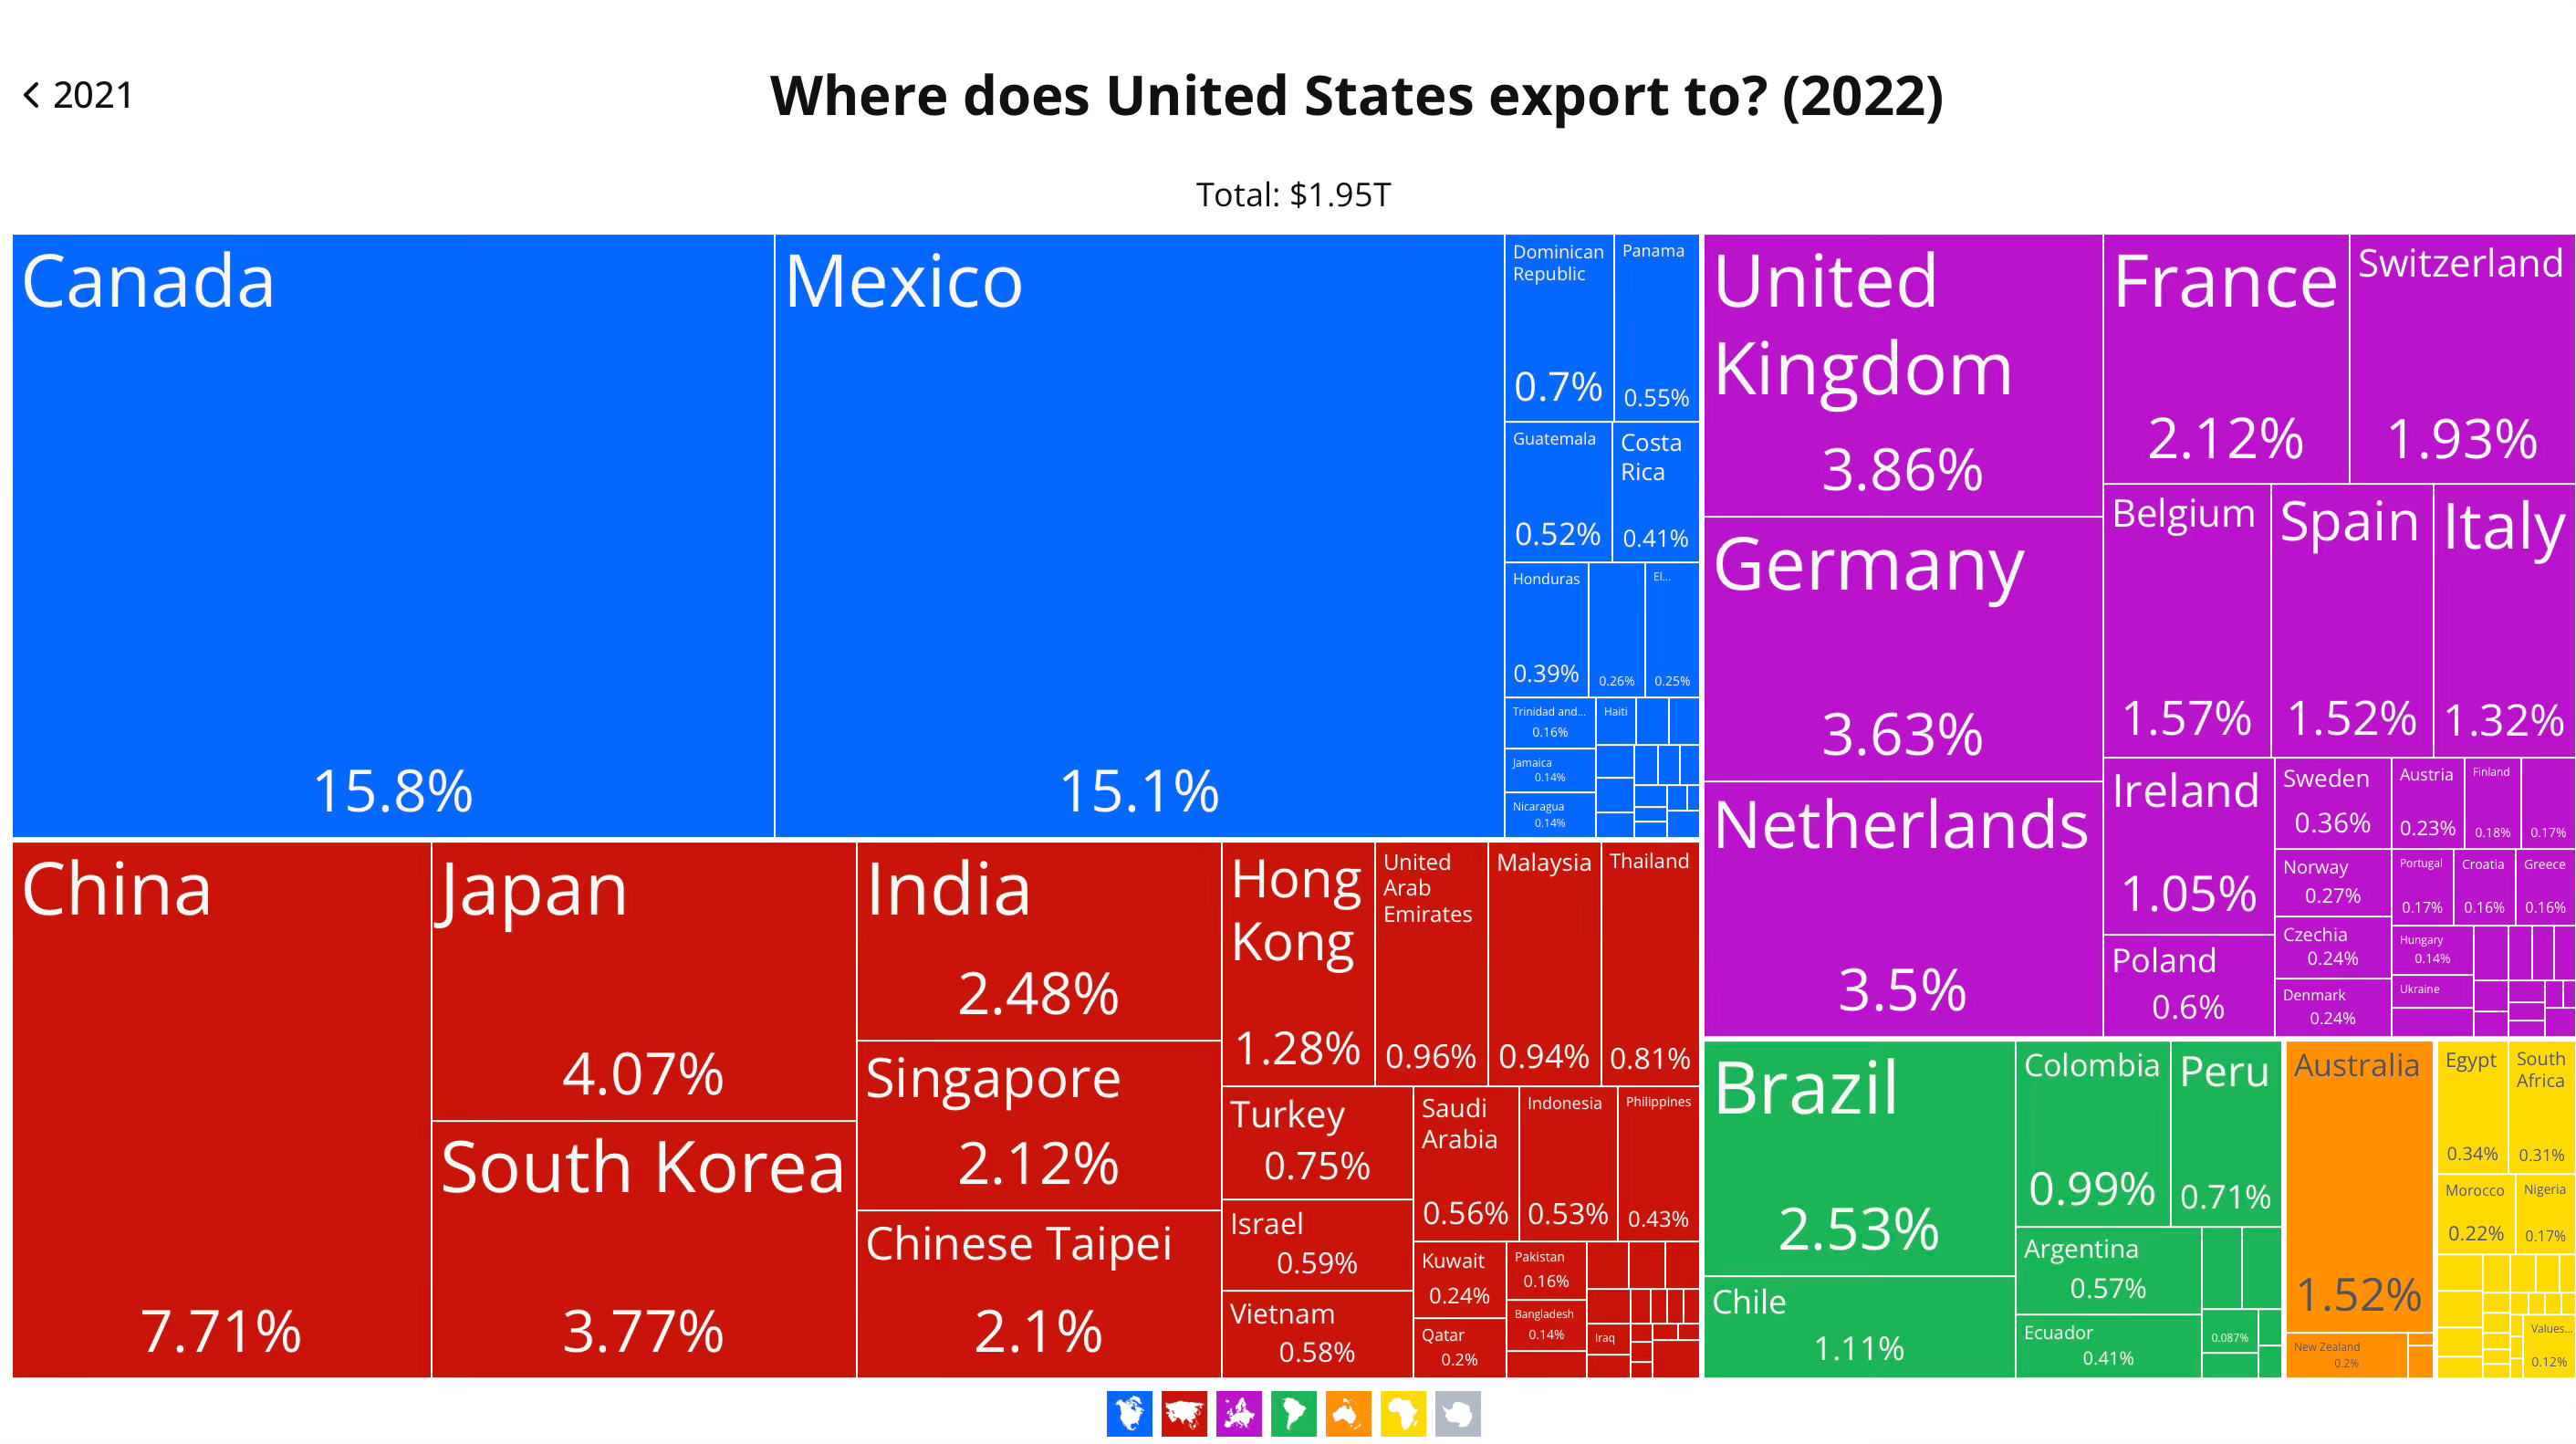
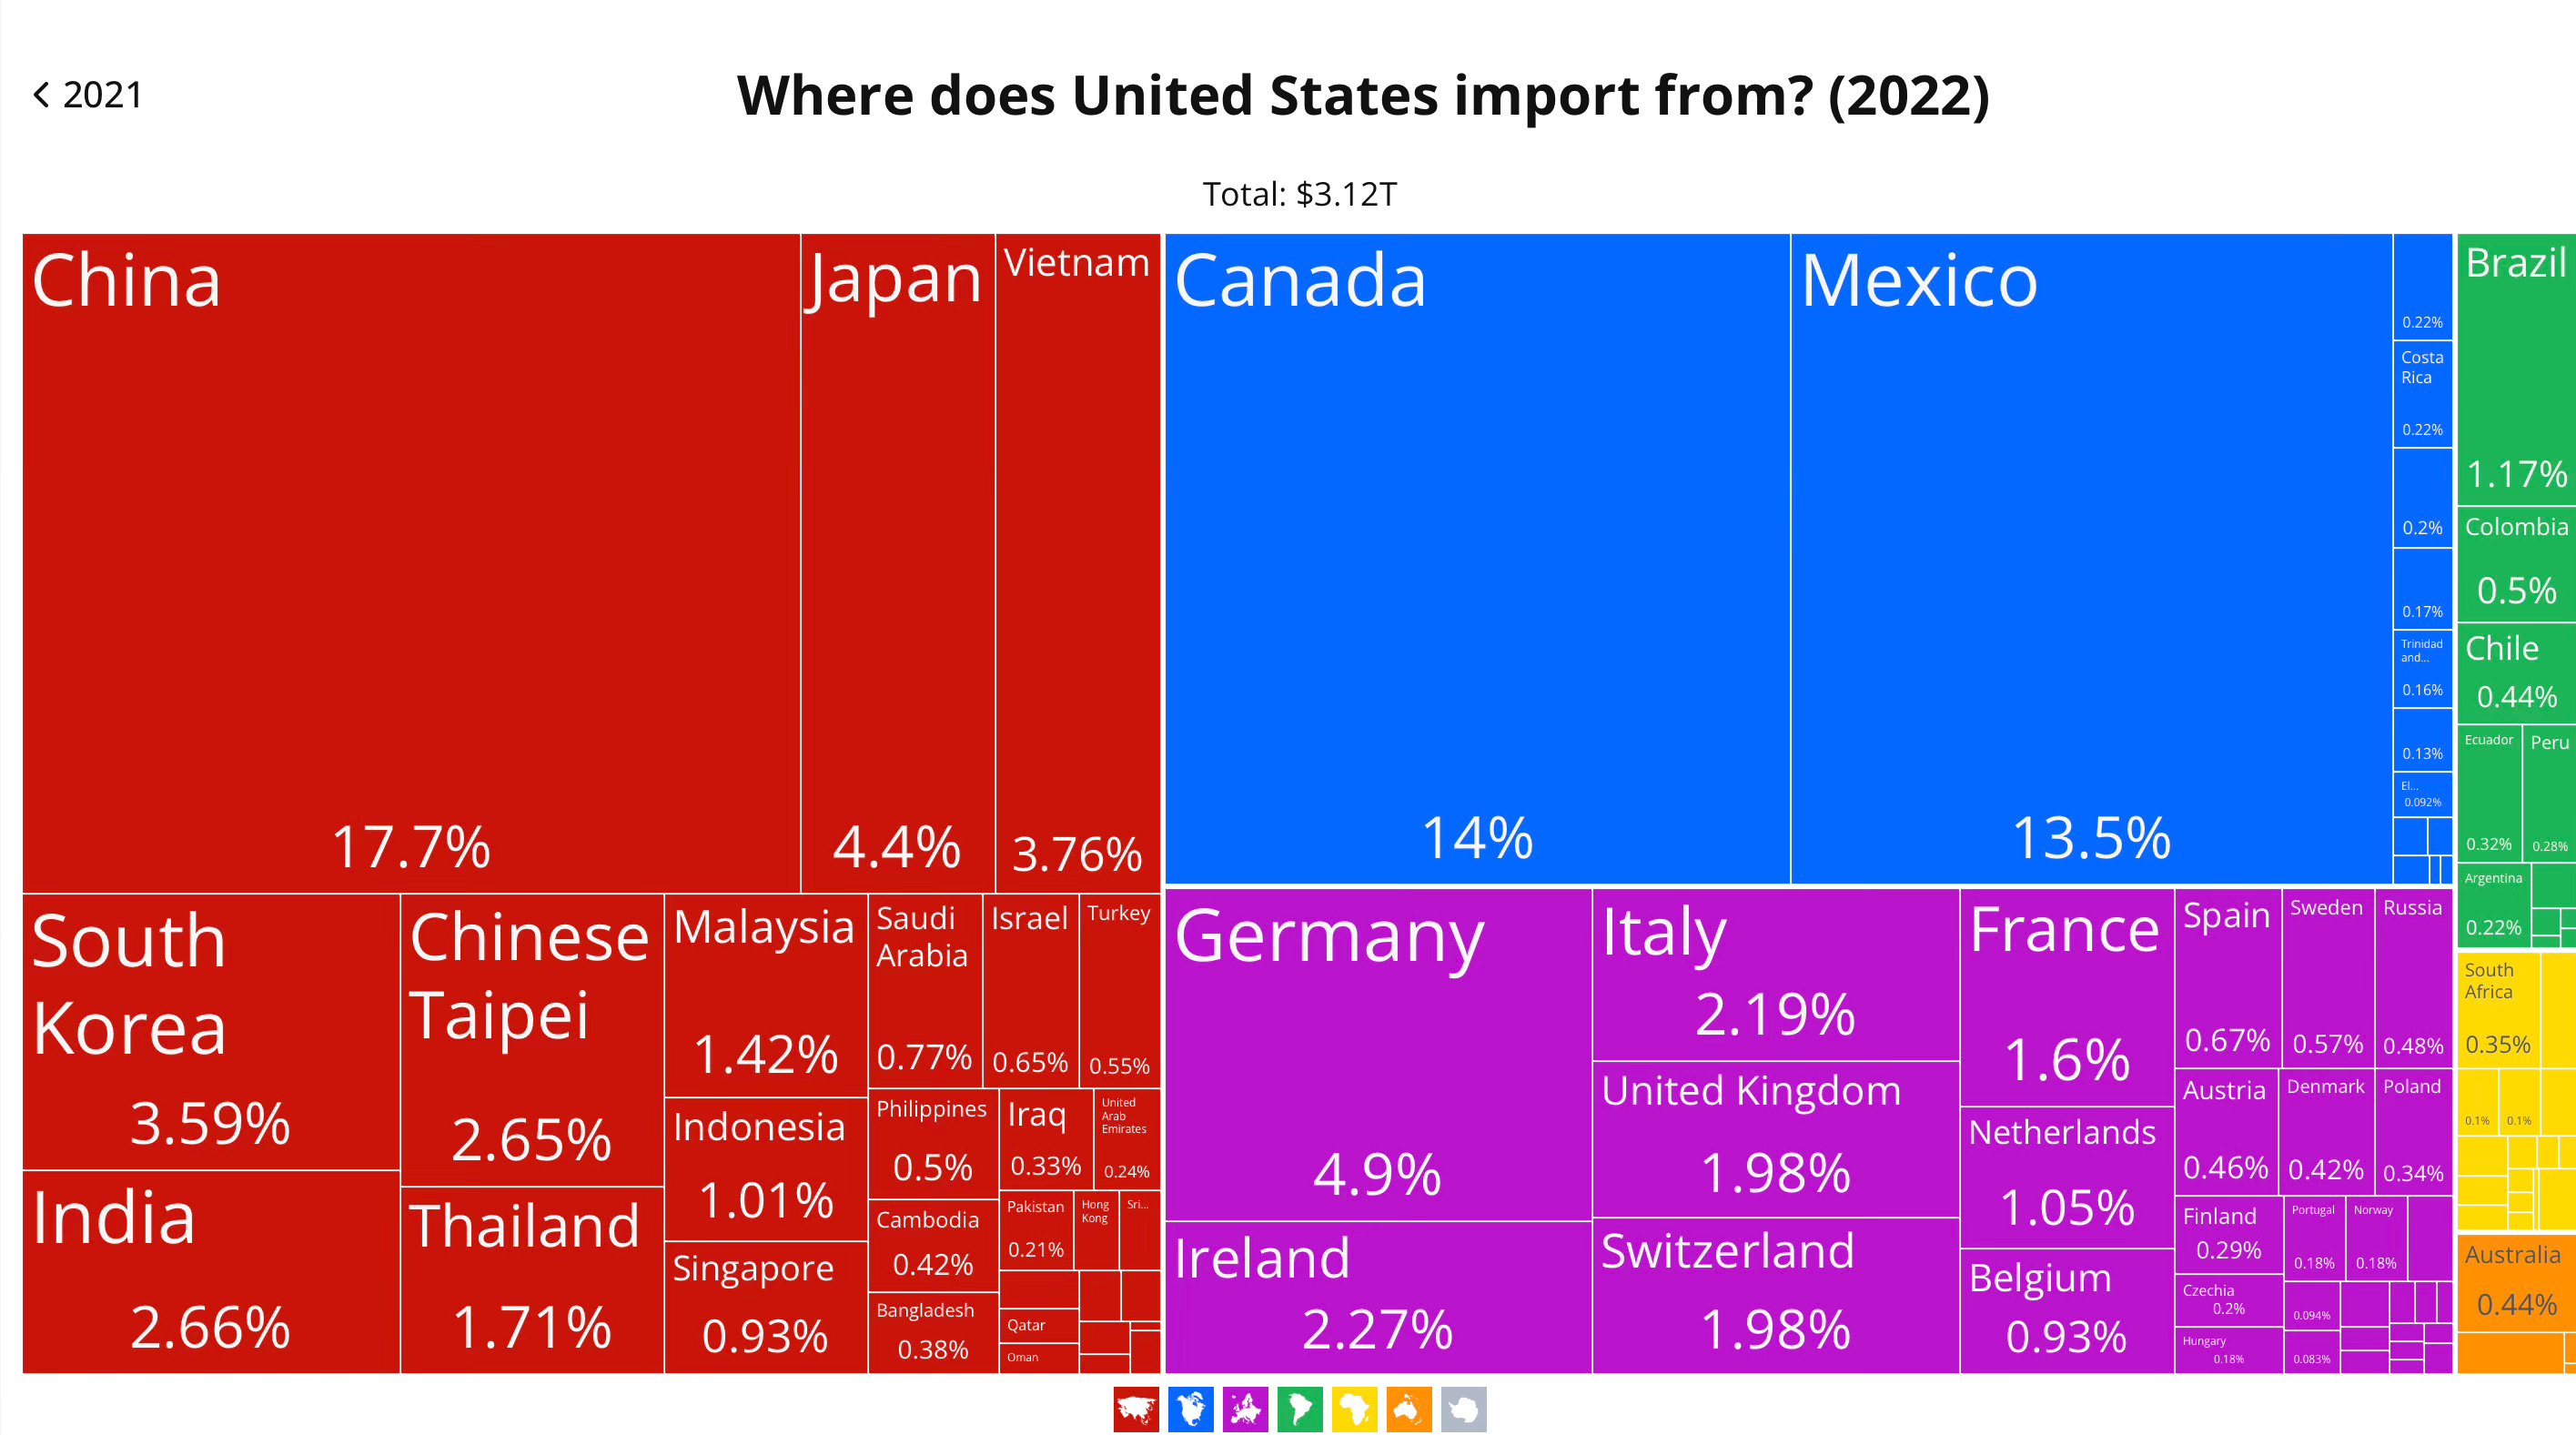
The color coding is by region, which means you suffer OEC’s choices, like their decision to cast North Africa and Sub-Saharan Africa together versus pairing the former with the Middle East (which OEC subsumes within Asia writ large).
How you get around that it to generate your own categories and then enter in each nation (tedious but fruitful).
So, for example, I generate a list for MENA (Middle East and North Africa) and punch in 21 countries (Egypt, Morocco, Algeria, Libya, Sudan, Tunisia, Djibouti, UAE, Bahrain, Iran, Iraq, Israel, Jordan, Kuwait, Lebanon, Palestine, Oman, Qatar, Saudi Arabia, Syria, and Yemen), and then ask for a tree map of that group’s export destinations, which, when rendered, will include intra-trade within that region. So I slice that data out and then I have a clearer reading of this is where MENA as an aggregate exports to and imports from on a regional basis.
Once there, I don’t have to worry that OEC’s regional groupings don’t match with mine, because I am really only interested in the superpower shares, so I take the hard money-value numbers and calculate against the remaining whole (here, the non-intra MENA exports) to get a share for China (easy), India (easy), US (easy), Russia (easy), and the EU (harder).
For the EU, I have to zero out all the other regions, get the European total, subtract Russia, and then calculate the percentage share.
First, to explain my regional categories:
North America is Canada, US and Mexico
Latin America is Central and South America plus the Caribbean
Europe is tantamount to the EU
The FSU/CIS cluster is Russia plus the old Soviet republics it still dominates or who can’t be considered European per se (Belarus, Caucasus, the Stans)
MENA is Middle East and Arab North Africa
Sub-Saharan Africa is everything else on the continent
South Asia is India plus its sub-continent neighbors
East Asia is China plus the rest, along with all the West Pac island states (including continental Australia, for example).
So here’s what I came up with in terms of exports and it surprised me plenty:
Keep reading with a 7-day free trial
Subscribe to Thomas P.M. Barnett’s Global Throughlines to keep reading this post and get 7 days of free access to the full post archives.