Dems v. Reps running for, and running, the White House
I consider the patterns and record as my family gears up to vote in Ohio, New Mexico, and Wisconsin
First off, do you realize that a White man has lost every POTUS election since 1790 except for one? And yet the two parties keep trying! Is that not the definition of insanity?
Okay, let’s call that pattern #1.
Conversely, isn’t it interesting that, starting with 2008, the Dems haven’t run a White guy four out of the last five times? While the Republicans have only run White guys?
Okay, let’s call that pattern #2.
A while back, I posted on how the optimistic candidate tends to win.
Optimism wins because pessimism is not in the US nature
Most political commentators start with the 1948 presidential election to describe the modern political era of campaigning, and so I will here. That’s a total of 19 elections.
That’s another pattern I believe in, although it’s personality and not party dependent.
Then’s there’s the one about which candidate is taller:
There is a slight tendency for winners of presidential elections to be taller than their opponents, though the difference is quite small (1.24 centimeters or 0.49 inches) and not significant. It does appear, however, as if the height advantage, slight though it may be, is getting more pronounced over time. If one considers presidential elections 1988 – 2012, winners average 1.07 centimeters (0.42 inches) shorter than their opponents. In the past 100 years (1916 – 2018, actually), however, winners average 3.81 centimeters (1.50 inches) taller than their opponents. More startling, still, it has been 118 years since we elected a president who was shorter than the average American male at the time and, since then, the average U.S. president has been 11.23 centimeter (4.42 inches) taller than the average American male, which is a pretty noticeable difference.
Hmm. Kamala is 5’ 4.25” tall — just above the average height for a US woman (5’ 3.5”). So, somebody for the average woman to look up to, but clearly a whole lot shorter than Trump.
Have we ever had a smaller POTUS?
Yes.
James Madison at 5’4”.
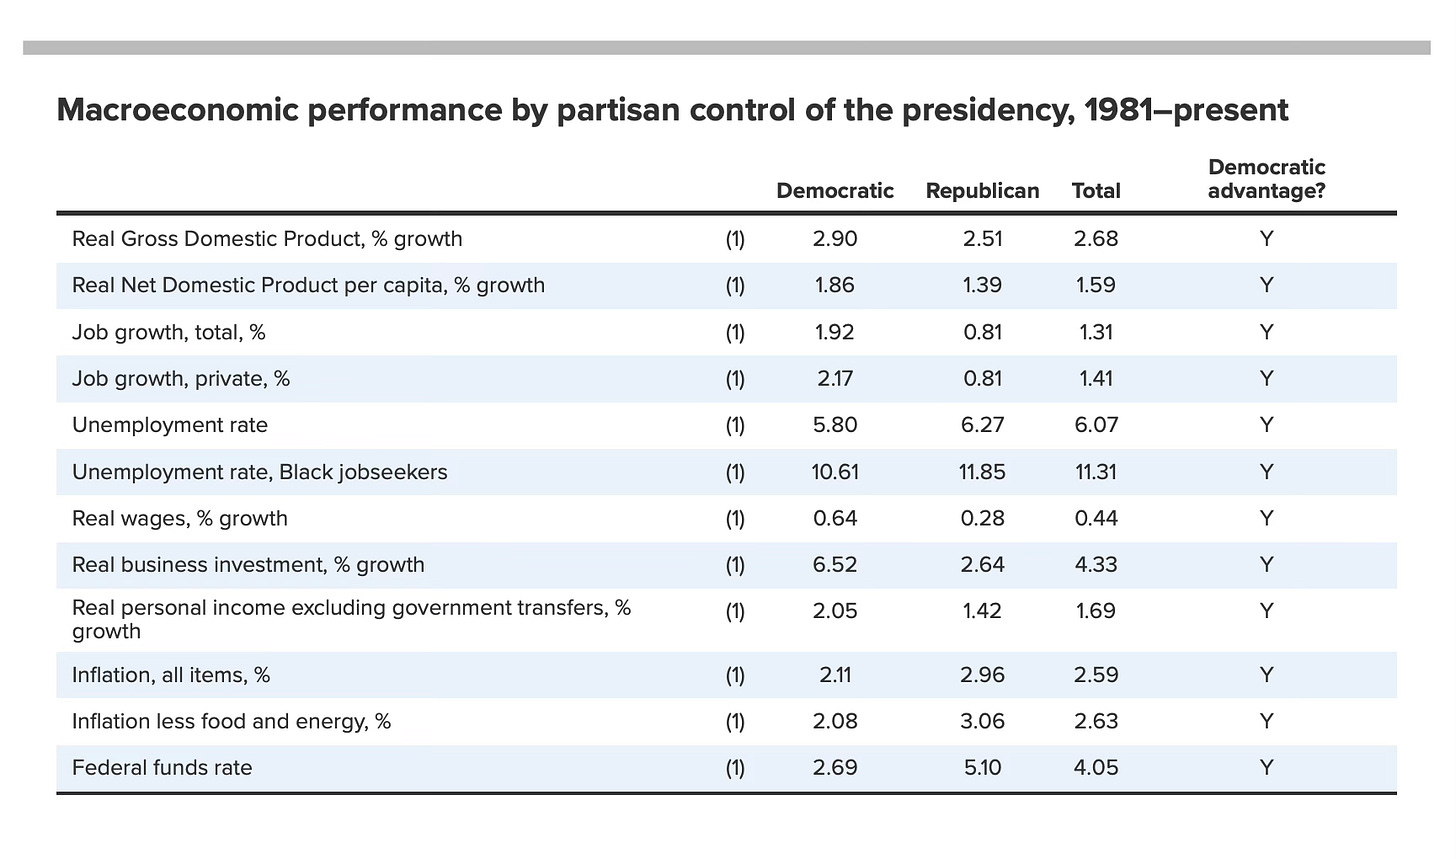
Bouncing around between profound and trivial, let’s compare Dems and Reps on recent growth rates (something I found in Brad Delong’s Substack recently, with him pulling from this source):
Here’s the numbers:
On that score, and considering Harris a surrogate/continuation of Biden, there’s no competition between her record and Trump’s, with — of course — the huge asterisk that was the pandemic. Still, the Dems look pretty good in this light.
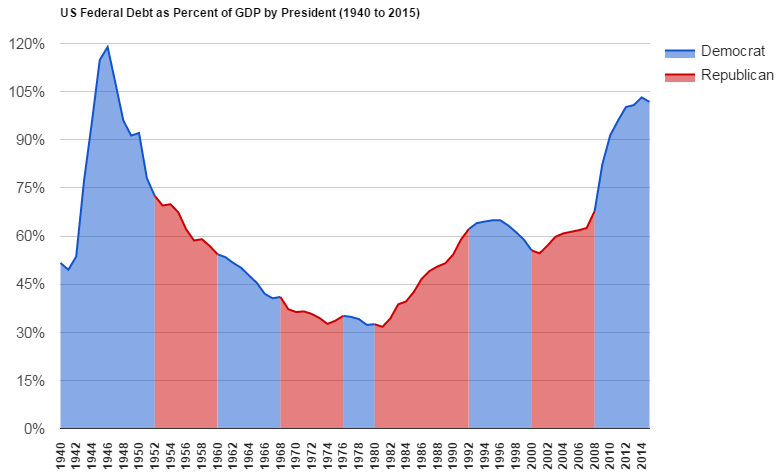
Here’s another measure that informed a slide I long used — namely, who runs up debt:
Lesson here would seem to be, avoid wars (FDR, Wilson) and huge military buildups coupled with tax cuts (Reagan, Bush, Trump as well). Again with the Biden/Trump comparison, you’d have to go with Harris — something predicted presently on the basis of comprising Trump and Harris’ economic plans.
NYT: Trump’s Plans Could Increase U.S. Debt While Raising Costs for Most Americans: A new analysis finds that Vice President Kamala Harris and former President Donald J. Trump’s plans would both add to the deficit, but Mr. Trump’s proposals could create a fiscal hole twice as big.
Absolute US debt by administration looks like this (best chart I could find):
I can look at this and say bipartisan reduction from WWII until Reaganomics balloons the deficit, later trimmed by Dem Clinton, only to re-explode under Obama’s tussle with the Great Financial Crisis/Great Recession. Things naturally got even worse with the subsequent pandemic.
Taking a longer view that includes the pandemic:
I get the sense of a long demographic dividend paying out across America’s heyday as world economic giant and then eventually succumbing to our demographic aging and the higher government costs associated with “entitlements.” In short, that seems structural and thus beyond the realm of economic policy differentiated by party ethos.
What else can I drudge up?
How about job creation? Here I can cite the favorable-to-Biden/Harris Q3 report of 254,000 jobs added.
Here again, the Dems surprise by ruining the traditional narrative that GOP presidents yield better economic results across a cluster of measures:
I would say that’s a pattern.
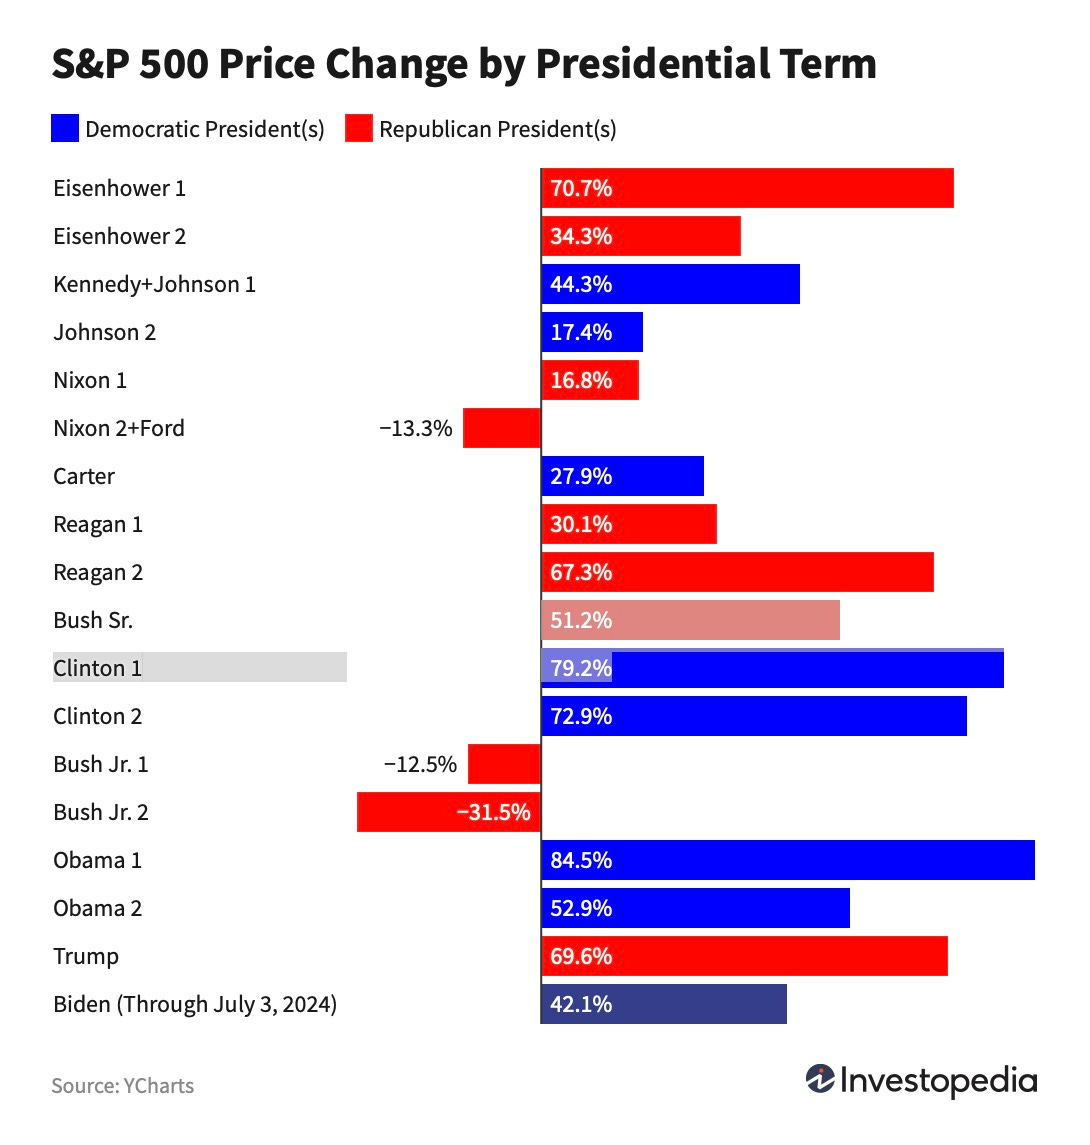
How about stock markets?
The academic, evidence-based judgment here?
Does It Matter Who Is President As It Relates to Stock Market Performance?
No. History shows that neither party affiliation, nor who the incumbent is has any direct effect on the performance of stocks.
Pretty much what I expected.
More generally on policy, we can state these observations:
Dems generally advocate for expanding healthcare access and reducing costs, while Republicans focus on privatization and reducing government spending.
Democratic policies often seek increased taxes on higher incomes to fund social programs, whereas Republicans typically push for tax cuts aimed at stimulating business growth and making the rich ultra-rich!
Dems tend to support more regulatory oversight in various sectors (e.g., environmental protections, working conditions), while Republicans often advocate for deregulation to promote economic freedom (for businesses, not workers).
Democrats usually emphasize social equity and rights (e.g., reproductive rights), while Republicans typically prioritize traditional values and law enforcement (the so-called culture wars).
Most generally (and the “truth” I sought to undercut with this drill), there are public perceptions: the public, as a rule, believes Republicans are better managers of the economy, even though the record says otherwise. Within that reality, there is the larger pattern that, when the public is unhappy with the economy, the incumbents typically suffer (classic examples being Jimmy Carter in 1980, George H.W. Bush in 1992 and Trump in 2020).
That’s a tricky one this time around because we have an incumbent VP running against a former president from another party, which, as far as I can tell, has never happened before. Previous instances of vice presidents running for president usually involved them either succeeding their presidents or running within the same party.
I say that because Trump would be only the second president, after Grover Cleveland, to re-win the office after losing the office. Cleveland won in 1884 over a former SECSTATE, then lost to a former senator (Harrison) in 1888, then beat a sitting POTUS (Harrison) in 1892.
Looking back over history, the closest election to this one featuring a sitting Veep v. a former POTUS would be sitting veep Humphrey taking on former veep Nixon in 1968.
To find another one, we have to go back to 1800 and find sitting veep Jefferson (starting the Dem-Rep party of that era) taking on sitting POTUS Adams and winning.
So, this time around is truly unique (sitting veep v fmr. POTUS), meaning both sides are, in effect, arguing against four more years! (Harris as four more of Biden and Trump as four more of Trump).
How many former presidents tried to regain office?
Martin Van Buren, 1848 (lost)
Millard Fillmore, 1856 (lost)
Cleveland in 1892 (sole win)
Teddy Roosevelt, 1912 (lost)
Trump in 2024 (TBD).
On that measure, it doesn’t look good for Trump.
Former veeps running?
Nixon in 1968 (won)
Mondale in 1984 (lost)
Biden in 2020 (win).
So, a pretty recent occurrence with a strong chance of winning, except we remember that Harris isn’t a former.
So how about sitting veeps?
Adams, 1796 (won)
Jefferson, 1800 (won)
Van Buren, 1836 (won)
Breckinridge, 1860 (lost)
Nixon, 1960 (lost)
Humphrey, 1968 (lost)
Bush, 1988 (won)
Gore, 2000 (lost)
Harris, 2024 (?).
There, modern history is unfavorable to Harris, as “third terms” are hard to pull off.
Finally, let me cite and explore the “13 keys” approach used by famous POTUS predictor historian Allan Lichtman (with less-famous mathematician Vladimir Keilis-Borok) in the formula that has accurately predicted every race since 1984 except for Gore-Bush, where SCOTUS got to make the call.
Keep reading with a 7-day free trial
Subscribe to Thomas P.M. Barnett’s Global Throughlines to keep reading this post and get 7 days of free access to the full post archives.


